Multiple Time Series Forecasting with PyCaret
Multiple Time Series Forecasting with PyCaret
Imports
import pandas as pd
import numpy as np
import warnings
warnings.filterwarnings('ignore')
import plotly.express as px
from pycaret.regression import *
from tqdm import tqdm
data = pd.read_csv('../exercise/store_item/train.csv')
data['date'] = pd.to_datetime(data['date'])
data['store'] = ['store_' + str(i) for i in data['store']]
data['item'] = ['item_' + str(i) for i in data['item']]
data['time_series'] = data[['store', 'item']].apply(lambda x: '_'.join(x), axis=1)
data.drop(['store', 'item'], axis=1, inplace=True)
data['month'] = [i.month for i in data['date']]
data['year'] = [i.year for i in data['date']]
data['day_of_week'] = [i.dayofweek for i in data['date']]
data['day_of_year'] = [i.dayofyear for i in data['date']]
data.head()
| date | sales | time_series | month | year | day_of_week | day_of_year | |
|---|---|---|---|---|---|---|---|
| 0 | 2013-01-01 | 13 | store_1_item_1 | 1 | 2013 | 1 | 1 |
| 1 | 2013-01-02 | 11 | store_1_item_1 | 1 | 2013 | 2 | 2 |
| 2 | 2013-01-03 | 14 | store_1_item_1 | 1 | 2013 | 3 | 3 |
| 3 | 2013-01-04 | 13 | store_1_item_1 | 1 | 2013 | 4 | 4 |
| 4 | 2013-01-05 | 10 | store_1_item_1 | 1 | 2013 | 5 | 5 |
data['time_series'].nunique()
500
Plot
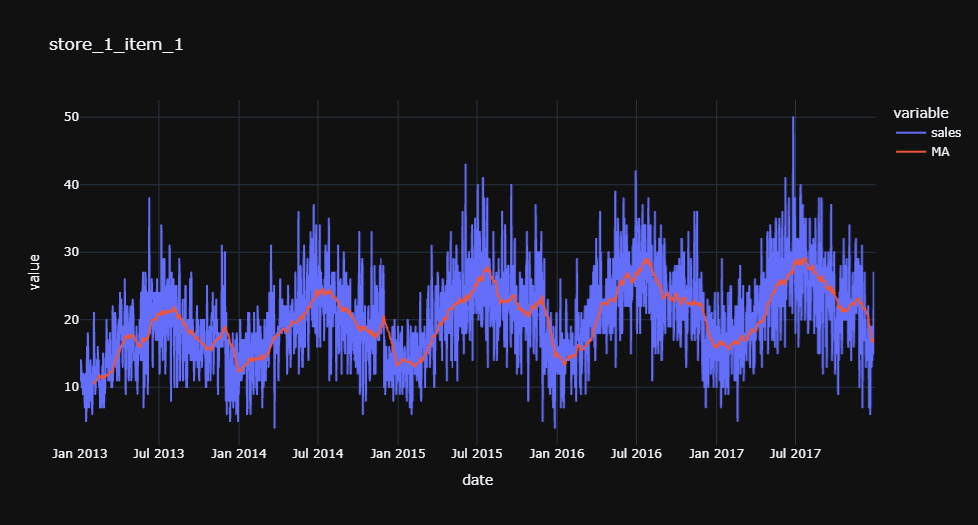
idx = data['time_series'].unique()[0]
subset = data[data['time_series'] == idx]
subset['MA'] = subset['sales'].rolling(30).mean()
fig = px.line(subset, x='date', y=['sales', 'MA'], title=idx, template='plotly_dark')
fig.show()

Training for store_1_item_1
df_subset = data[data['time_series'] == idx]
df_subset.shape
(1826, 7)
s = setup(df_subset, target='sales', train_size=0.95, data_split_shuffle=False, fold_strategy='timeseries', fold=3,
         ignore_features = ['date', 'time_series'], numeric_features=['day_of_year','year'],
          categorical_features=['month', 'day_of_week'], session_id = 1234)
| Description | Value | |
|---|---|---|
| 0 | session_id | 1234 |
| 1 | Target | sales |
| 2 | Original Data | (1826, 7) |
| 3 | Missing Values | False |
| 4 | Numeric Features | 2 |
| 5 | Categorical Features | 2 |
| 6 | Ordinal Features | False |
| 7 | High Cardinality Features | False |
| 8 | High Cardinality Method | None |
| 9 | Transformed Train Set | (1734, 21) |
| 10 | Transformed Test Set | (92, 21) |
| 11 | Shuffle Train-Test | False |
| 12 | Stratify Train-Test | False |
| 13 | Fold Generator | TimeSeriesSplit |
| 14 | Fold Number | 3 |
| 15 | CPU Jobs | -1 |
| 16 | Use GPU | False |
| 17 | Log Experiment | False |
| 18 | Experiment Name | reg-default-name |
| 19 | USI | cd06 |
| 20 | Imputation Type | simple |
| 21 | Iterative Imputation Iteration | None |
| 22 | Numeric Imputer | mean |
| 23 | Iterative Imputation Numeric Model | None |
| 24 | Categorical Imputer | constant |
| 25 | Iterative Imputation Categorical Model | None |
| 26 | Unknown Categoricals Handling | least_frequent |
| 27 | Normalize | False |
| 28 | Normalize Method | None |
| 29 | Transformation | False |
| 30 | Transformation Method | None |
| 31 | PCA | False |
| 32 | PCA Method | None |
| 33 | PCA Components | None |
| 34 | Ignore Low Variance | False |
| 35 | Combine Rare Levels | False |
| 36 | Rare Level Threshold | None |
| 37 | Numeric Binning | False |
| 38 | Remove Outliers | False |
| 39 | Outliers Threshold | None |
| 40 | Remove Multicollinearity | False |
| 41 | Multicollinearity Threshold | None |
| 42 | Remove Perfect Collinearity | True |
| 43 | Clustering | False |
| 44 | Clustering Iteration | None |
| 45 | Polynomial Features | False |
| 46 | Polynomial Degree | None |
| 47 | Trignometry Features | False |
| 48 | Polynomial Threshold | None |
| 49 | Group Features | False |
| 50 | Feature Selection | False |
| 51 | Feature Selection Method | classic |
| 52 | Features Selection Threshold | None |
| 53 | Feature Interaction | False |
| 54 | Feature Ratio | False |
| 55 | Interaction Threshold | None |
| 56 | Transform Target | False |
| 57 | Transform Target Method | box-cox |
best_model = compare_models(sort='MAE')
| Model | MAE | MSE | RMSE | R2 | RMSLE | MAPE | TT (Sec) | |
|---|---|---|---|---|---|---|---|---|
| br | Bayesian Ridge | 3.7656 | 22.3829 | 4.7245 | 0.4782 | 0.2346 | 0.2114 | 0.0067 |
| ridge | Ridge Regression | 3.7711 | 22.4091 | 4.7278 | 0.4772 | 0.2352 | 0.2124 | 0.5100 |
| lr | Linear Regression | 3.7802 | 22.4823 | 4.7364 | 0.4747 | 0.2360 | 0.2137 | 0.7267 |
| lightgbm | Light Gradient Boosting Machine | 3.9912 | 25.6055 | 5.0594 | 0.3971 | 0.2429 | 0.2038 | 0.0333 |
| gbr | Gradient Boosting Regressor | 4.0101 | 26.1919 | 5.1171 | 0.3830 | 0.2422 | 0.2001 | 0.0333 |
| ada | AdaBoost Regressor | 4.1772 | 28.3098 | 5.3089 | 0.3409 | 0.2481 | 0.2129 | 0.0433 |
| rf | Random Forest Regressor | 4.2648 | 29.6002 | 5.4396 | 0.3006 | 0.2641 | 0.2153 | 0.2800 |
| huber | Huber Regressor | 4.3631 | 31.2640 | 5.5737 | 0.2780 | 0.2552 | 0.2028 | 0.0200 |
| xgboost | Extreme Gradient Boosting | 4.5708 | 33.5601 | 5.7889 | 0.2151 | 0.2863 | 0.2276 | 0.2400 |
| et | Extra Trees Regressor | 4.5897 | 34.1530 | 5.8431 | 0.1910 | 0.2934 | 0.2352 | 0.2400 |
| knn | K Neighbors Regressor | 4.8785 | 37.8773 | 6.1444 | 0.1191 | 0.2891 | 0.2424 | 0.0467 |
| dt | Decision Tree Regressor | 5.1239 | 42.4573 | 6.5113 | 0.0035 | 0.3303 | 0.2628 | 0.0100 |
| omp | Orthogonal Matching Pursuit | 5.3050 | 45.5557 | 6.7185 | -0.0503 | 0.3137 | 0.2706 | 0.0067 |
| en | Elastic Net | 5.5900 | 50.1346 | 7.0523 | -0.1647 | 0.3285 | 0.2809 | 0.5267 |
| lasso | Lasso Regression | 5.6448 | 51.1533 | 7.1169 | -0.1856 | 0.3314 | 0.2824 | 0.5167 |
| llar | Lasso Least Angle Regression | 5.8939 | 56.1759 | 7.4654 | -0.2946 | 0.3417 | 0.2815 | 0.0067 |
| par | Passive Aggressive Regressor | 6.3936 | 64.9179 | 8.0232 | -0.5318 | 0.3753 | 0.2990 | 0.0067 |
| lar | Least Angle Regression | 1084.2732 | 4596012.7859 | 1251.2497 | -100016.0471 | 1.9992 | 53.5604 | 0.0100 |
f = finalize_model(best_model)
Generate predictions
all_dates = pd.date_range(start='2013-01-01', end='2019-12-31', freq='D')
score_df = pd.DataFrame()
score_df['date'] = all_dates
score_df['month'] = [i.month for i in score_df['date']]
score_df['year'] = [i.year for i in score_df['date']]
score_df['day_of_week'] = [i.dayofweek for i in score_df['date']]
score_df['day_of_year'] = [i.dayofyear for i in score_df['date']]
score_df
| date | month | year | day_of_week | day_of_year | |
|---|---|---|---|---|---|
| 0 | 2013-01-01 | 1 | 2013 | 1 | 1 |
| 1 | 2013-01-02 | 1 | 2013 | 2 | 2 |
| 2 | 2013-01-03 | 1 | 2013 | 3 | 3 |
| 3 | 2013-01-04 | 1 | 2013 | 4 | 4 |
| 4 | 2013-01-05 | 1 | 2013 | 5 | 5 |
| ... | ... | ... | ... | ... | ... |
| 2551 | 2019-12-27 | 12 | 2019 | 4 | 361 |
| 2552 | 2019-12-28 | 12 | 2019 | 5 | 362 |
| 2553 | 2019-12-29 | 12 | 2019 | 6 | 363 |
| 2554 | 2019-12-30 | 12 | 2019 | 0 | 364 |
| 2555 | 2019-12-31 | 12 | 2019 | 1 | 365 |
2556 rows × 5 columns
from pycaret.regression import predict_model
score = []
p = predict_model(f, data=score_df)
p['time_series'] = idx
p
| date | month | year | day_of_week | day_of_year | Label | time_series | |
|---|---|---|---|---|---|---|---|
| 0 | 2013-01-01 | 1 | 2013 | 1 | 1 | 8.927565 | store_1_item_1 |
| 1 | 2013-01-02 | 1 | 2013 | 2 | 2 | 9.515175 | store_1_item_1 |
| 2 | 2013-01-03 | 1 | 2013 | 3 | 3 | 10.213244 | store_1_item_1 |
| 3 | 2013-01-04 | 1 | 2013 | 4 | 4 | 11.780002 | store_1_item_1 |
| 4 | 2013-01-05 | 1 | 2013 | 5 | 5 | 13.710251 | store_1_item_1 |
| ... | ... | ... | ... | ... | ... | ... | ... |
| 2551 | 2019-12-27 | 12 | 2019 | 4 | 361 | 21.706059 | store_1_item_1 |
| 2552 | 2019-12-28 | 12 | 2019 | 5 | 362 | 23.636309 | store_1_item_1 |
| 2553 | 2019-12-29 | 12 | 2019 | 6 | 363 | 24.467096 | store_1_item_1 |
| 2554 | 2019-12-30 | 12 | 2019 | 0 | 364 | 16.320039 | store_1_item_1 |
| 2555 | 2019-12-31 | 12 | 2019 | 1 | 365 | 18.949996 | store_1_item_1 |
2556 rows × 7 columns
final_df = pd.merge(p, data, how='left', left_on = ['date','time_series'], right_on=['date','time_series'])
final_df
| date | month_x | year_x | day_of_week_x | day_of_year_x | Label | time_series | sales | month_y | year_y | day_of_week_y | day_of_year_y | |
|---|---|---|---|---|---|---|---|---|---|---|---|---|
| 0 | 2013-01-01 | 1 | 2013 | 1 | 1 | 8.927565 | store_1_item_1 | 13.0 | 1.0 | 2013.0 | 1.0 | 1.0 |
| 1 | 2013-01-02 | 1 | 2013 | 2 | 2 | 9.515175 | store_1_item_1 | 11.0 | 1.0 | 2013.0 | 2.0 | 2.0 |
| 2 | 2013-01-03 | 1 | 2013 | 3 | 3 | 10.213244 | store_1_item_1 | 14.0 | 1.0 | 2013.0 | 3.0 | 3.0 |
| 3 | 2013-01-04 | 1 | 2013 | 4 | 4 | 11.780002 | store_1_item_1 | 13.0 | 1.0 | 2013.0 | 4.0 | 4.0 |
| 4 | 2013-01-05 | 1 | 2013 | 5 | 5 | 13.710251 | store_1_item_1 | 10.0 | 1.0 | 2013.0 | 5.0 | 5.0 |
| ... | ... | ... | ... | ... | ... | ... | ... | ... | ... | ... | ... | ... |
| 2551 | 2019-12-27 | 12 | 2019 | 4 | 361 | 21.706059 | store_1_item_1 | NaN | NaN | NaN | NaN | NaN |
| 2552 | 2019-12-28 | 12 | 2019 | 5 | 362 | 23.636309 | store_1_item_1 | NaN | NaN | NaN | NaN | NaN |
| 2553 | 2019-12-29 | 12 | 2019 | 6 | 363 | 24.467096 | store_1_item_1 | NaN | NaN | NaN | NaN | NaN |
| 2554 | 2019-12-30 | 12 | 2019 | 0 | 364 | 16.320039 | store_1_item_1 | NaN | NaN | NaN | NaN | NaN |
| 2555 | 2019-12-31 | 12 | 2019 | 1 | 365 | 18.949996 | store_1_item_1 | NaN | NaN | NaN | NaN | NaN |
2556 rows × 12 columns
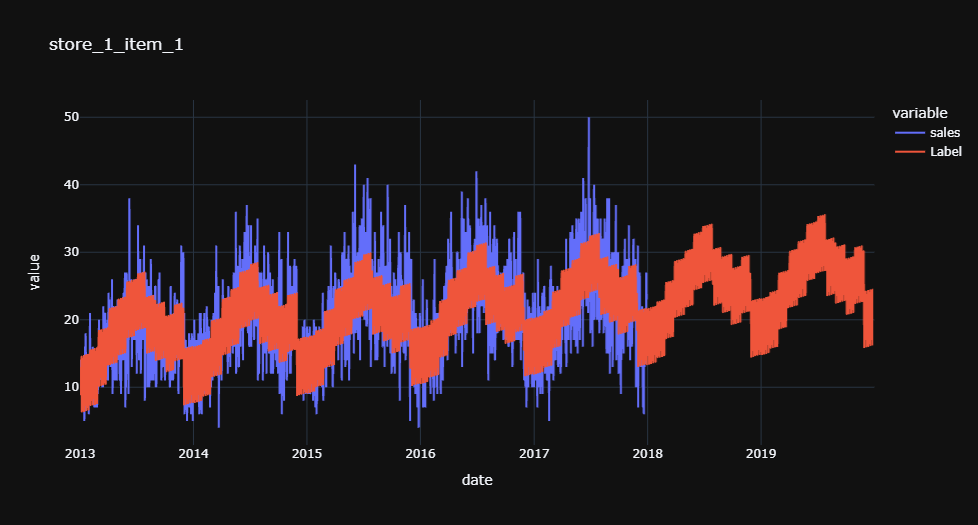
fig = px.line(final_df, x='date',y=['sales','Label'], title=idx, template='plotly_dark')
fig.show()
