Anomaly Detection
Anomaly Detection은 대부분의 데이터와 크게 다른 희귀한 데이터, 사건을 식별하는데 사용되는 기법이다. 세가지 그룹으로 분류할 수 있는데,
- Supervised : 데이터 셋에 비정상 데이터와 정상 데이터를 식별하는 레이블이 있는 경우 사용된다.
- Unsupervised : 전체 데이터에 대해 레이블이 없고, 대부분의 데이터가 정상 상태라고 가정한다.
- Semi-supervised : 이상 현상이 없는 데이터에 대해 학습하고, 훈련된 모형이 새 데이터에 사용되는 경우 훈련된 모형의 데이터 분포를 기반으로 새 데이터에 대해 예측한다.
Data
import pandas as pd
import numpy as np
import plotly.express as px
data = pd.read_csv('https://raw.githubusercontent.com/numenta/NAB/master/data/realKnownCause/nyc_taxi.csv')
data['timestamp'] = pd.to_datetime(data['timestamp'])
data.head()
|
timestamp |
value |
| 0 |
2014-07-01 00:00:00 |
10844 |
| 1 |
2014-07-01 00:30:00 |
8127 |
| 2 |
2014-07-01 01:00:00 |
6210 |
| 3 |
2014-07-01 01:30:00 |
4656 |
| 4 |
2014-07-01 02:00:00 |
3820 |
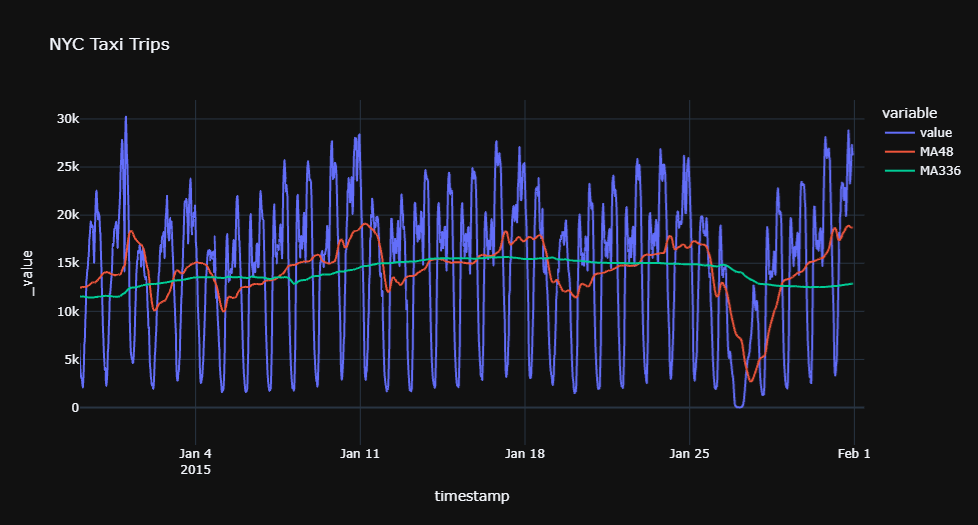
MA
data['MA48'] = data['value'].rolling(48).mean()
data['MA336'] = data['value'].rolling(336).mean()
Plotly
fig = px.line(data, x="timestamp", y=['value', 'MA48', 'MA336'], title='NYC Taxi Trips', template = 'plotly_dark')
fig.show()
Data Preparation
data.drop(['MA48','MA336'], axis=1, inplace=True)
data.set_index('timestamp', drop=True, inplace=True)
data = data.resample('H').sum()

data['day'] = [i.day for i in data.index]
data['day_name'] = [i.day_name() for i in data.index]
data['day_of_year'] = [i.dayofyear for i in data.index]
data['week_of_year'] = [i.weekofyear for i in data.index]
data['hour'] = [i.hour for i in data.index]
data['is_weekday'] = [i.isoweekday() for i in data.index]
|
value |
day |
day_name |
day_of_year |
week_of_year |
hour |
is_weekday |
| timestamp |
|
|
|
|
|
|
|
| 2014-07-01 00:00:00 |
18971 |
1 |
Tuesday |
182 |
27 |
0 |
2 |
| 2014-07-01 01:00:00 |
10866 |
1 |
Tuesday |
182 |
27 |
1 |
2 |
| 2014-07-01 02:00:00 |
6693 |
1 |
Tuesday |
182 |
27 |
2 |
2 |
| 2014-07-01 03:00:00 |
4433 |
1 |
Tuesday |
182 |
27 |
3 |
2 |
| 2014-07-01 04:00:00 |
4379 |
1 |
Tuesday |
182 |
27 |
4 |
2 |
Experiment Setup
from pycaret.anomaly import *
s = setup(data, session_id=1234)
| Description | Value |
| 0 |
session_id |
1234 |
| 1 |
Original Data |
(5160, 7) |
| 2 |
Missing Values |
False |
| 3 |
Numeric Features |
5 |
| 4 |
Categorical Features |
2 |
| 5 |
Ordinal Features |
False |
| 6 |
High Cardinality Features |
False |
| 7 |
High Cardinality Method |
None |
| 8 |
Transformed Data |
(5160, 19) |
| 9 |
CPU Jobs |
-1 |
| 10 |
Use GPU |
False |
| 11 |
Log Experiment |
False |
| 12 |
Experiment Name |
anomaly-default-name |
| 13 |
USI |
f43c |
| 14 |
Imputation Type |
simple |
| 15 |
Iterative Imputation Iteration |
None |
| 16 |
Numeric Imputer |
mean |
| 17 |
Iterative Imputation Numeric Model |
None |
| 18 |
Categorical Imputer |
mode |
| 19 |
Iterative Imputation Categorical Model |
None |
| 20 |
Unknown Categoricals Handling |
least_frequent |
| 21 |
Normalize |
False |
| 22 |
Normalize Method |
None |
| 23 |
Transformation |
False |
| 24 |
Transformation Method |
None |
| 25 |
PCA |
False |
| 26 |
PCA Method |
None |
| 27 |
PCA Components |
None |
| 28 |
Ignore Low Variance |
False |
| 29 |
Combine Rare Levels |
False |
| 30 |
Rare Level Threshold |
None |
| 31 |
Numeric Binning |
False |
| 32 |
Remove Outliers |
False |
| 33 |
Outliers Threshold |
None |
| 34 |
Remove Multicollinearity |
False |
| 35 |
Multicollinearity Threshold |
None |
| 36 |
Remove Perfect Collinearity |
False |
| 37 |
Clustering |
False |
| 38 |
Clustering Iteration |
None |
| 39 |
Polynomial Features |
False |
| 40 |
Polynomial Degree |
None |
| 41 |
Trignometry Features |
False |
| 42 |
Polynomial Threshold |
None |
| 43 |
Group Features |
False |
| 44 |
Feature Selection |
False |
| 45 |
Feature Selection Method |
classic |
| 46 |
Features Selection Threshold |
None |
| 47 |
Feature Interaction |
False |
| 48 |
Feature Ratio |
False |
| 49 |
Interaction Threshold |
None |
|
Name |
Reference |
| ID |
|
|
| abod |
Angle-base Outlier Detection |
pyod.models.abod.ABOD |
| cluster |
Clustering-Based Local Outlier |
pyod.models.cblof.CBLOF |
| cof |
Connectivity-Based Local Outlier |
pyod.models.cof.COF |
| iforest |
Isolation Forest |
pyod.models.iforest.IForest |
| histogram |
Histogram-based Outlier Detection |
pyod.models.hbos.HBOS |
| knn |
K-Nearest Neighbors Detector |
pyod.models.knn.KNN |
| lof |
Local Outlier Factor |
pyod.models.lof.LOF |
| svm |
One-class SVM detector |
pyod.models.ocsvm.OCSVM |
| pca |
Principal Component Analysis |
pyod.models.pca.PCA |
| mcd |
Minimum Covariance Determinant |
pyod.models.mcd.MCD |
| sod |
Subspace Outlier Detection |
pyod.models.sod.SOD |
| sos |
Stochastic Outlier Selection |
pyod.models.sos.SOS |
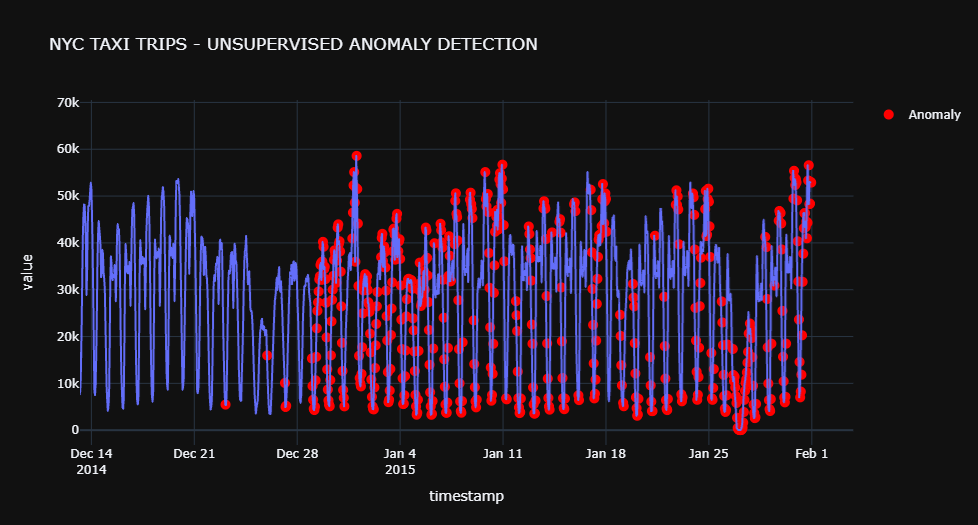
Train model
iforest = create_model('iforest', fraction=0.1)
iforest_results = assign_model(iforest)
|
value |
day |
day_name |
day_of_year |
week_of_year |
hour |
is_weekday |
Anomaly |
Anomaly_Score |
| timestamp |
|
|
|
|
|
|
|
|
|
| 2014-07-01 00:00:00 |
18971 |
1 |
Tuesday |
182 |
27 |
0 |
2 |
0 |
-0.008181 |
| 2014-07-01 01:00:00 |
10866 |
1 |
Tuesday |
182 |
27 |
1 |
2 |
0 |
-0.001049 |
| 2014-07-01 02:00:00 |
6693 |
1 |
Tuesday |
182 |
27 |
2 |
2 |
1 |
0.002064 |
| 2014-07-01 03:00:00 |
4433 |
1 |
Tuesday |
182 |
27 |
3 |
2 |
1 |
0.004900 |
| 2014-07-01 04:00:00 |
4379 |
1 |
Tuesday |
182 |
27 |
4 |
2 |
1 |
0.004525 |
iforest_results[iforest_results['Anomaly'] == 1].head()
|
value |
day |
day_name |
day_of_year |
week_of_year |
hour |
is_weekday |
Anomaly |
Anomaly_Score |
| timestamp |
|
|
|
|
|
|
|
|
|
| 2014-07-01 02:00:00 |
6693 |
1 |
Tuesday |
182 |
27 |
2 |
2 |
1 |
0.002064 |
| 2014-07-01 03:00:00 |
4433 |
1 |
Tuesday |
182 |
27 |
3 |
2 |
1 |
0.004900 |
| 2014-07-01 04:00:00 |
4379 |
1 |
Tuesday |
182 |
27 |
4 |
2 |
1 |
0.004525 |
| 2014-07-01 05:00:00 |
6879 |
1 |
Tuesday |
182 |
27 |
5 |
2 |
1 |
0.002196 |
| 2014-07-05 06:00:00 |
5698 |
5 |
Saturday |
186 |
27 |
6 |
6 |
1 |
0.000246 |
import plotly.graph_objects as go
# plot value on y-axis and date on x-axis
fig = px.line(iforest_results, x=iforest_results.index, y="value", title='NYC TAXI TRIPS - UNSUPERVISED ANOMALY DETECTION', template = 'plotly_dark')

# create list of outlier_dates
outlier_dates = iforest_results[iforest_results['Anomaly'] == 1].index

# obtain y value of anomalies to plot
y_values = [iforest_results.loc[i]['value'] for i in outlier_dates]
fig.add_trace(go.Scatter(x=outlier_dates, y=y_values, mode = 'markers', name = 'Anomaly', marker=dict(color='red',size=10)))

fig.show()
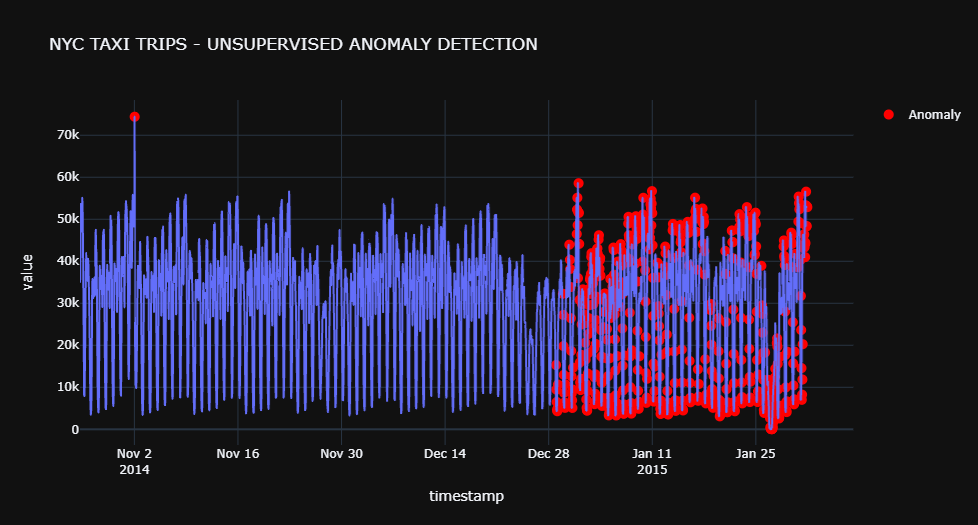
pca = create_model('pca', fraction=0.1)
pca_results = assign_model(pca)
# plot value on y-axis and date on x-axis
fig = px.line(pca_results, x=pca_results.index, y="value", title='NYC TAXI TRIPS - UNSUPERVISED ANOMALY DETECTION', template = 'plotly_dark')

# create list of outlier_dates
outlier_dates = pca_results[pca_results['Anomaly'] == 1].index

# obtain y value of anomalies to plot
y_values = [pca_results.loc[i]['value'] for i in outlier_dates]
fig.add_trace(go.Scatter(x=outlier_dates, y=y_values, mode = 'markers', name = 'Anomaly', marker=dict(color='red',size=10)))

fig.show()
Reference : Time Series Anomaly Detection with PyCaret