Time Series Forecasting with PyCaret Regression Module
Time Series Forecasting with PyCaret Regression Module
Imports
import pandas as pd
import numpy as np

from pycaret.regression import *
import plotly.express as px
Data
data = pd.read_csv('../exercise/data/airline_passengers.csv')
cols = ['Date','Passengers']
data.columns = cols
data['Date'] = pd.to_datetime(data['Date'])
data['Month'] = [i.month for i in data['Date']]
data['Year'] = [i.year for i in data['Date']]

data['Series'] = np.arange(1, len(data)+1)

data.drop(['Date'], axis=1, inplace=True)
data = data[['Series','Year','Month','Passengers']]
data.head()
| Series | Year | Month | Passengers | |
|---|---|---|---|---|
| 0 | 1 | 1949 | 1 | 112 |
| 1 | 2 | 1949 | 2 | 118 |
| 2 | 3 | 1949 | 3 | 132 |
| 3 | 4 | 1949 | 4 | 129 |
| 4 | 5 | 1949 | 5 | 121 |
train = data[data['Year'] < 1960]
test = data[data['Year'] >= 1960]
print(train.shape, test.shape)
(132, 4) (12, 4)
Setup
s = setup(data = train, test_data= test, target='Passengers', fold_strategy='timeseries',numeric_features=['Year','Series'],
         fold=3, transform_target= True, session_id=1234)
| Description | Value | |
|---|---|---|
| 0 | session_id | 1234 |
| 1 | Target | Passengers |
| 2 | Original Data | (132, 4) |
| 3 | Missing Values | False |
| 4 | Numeric Features | 2 |
| 5 | Categorical Features | 1 |
| 6 | Ordinal Features | False |
| 7 | High Cardinality Features | False |
| 8 | High Cardinality Method | None |
| 9 | Transformed Train Set | (132, 13) |
| 10 | Transformed Test Set | (12, 13) |
| 11 | Shuffle Train-Test | True |
| 12 | Stratify Train-Test | False |
| 13 | Fold Generator | TimeSeriesSplit |
| 14 | Fold Number | 3 |
| 15 | CPU Jobs | -1 |
| 16 | Use GPU | False |
| 17 | Log Experiment | False |
| 18 | Experiment Name | reg-default-name |
| 19 | USI | 420a |
| 20 | Imputation Type | simple |
| 21 | Iterative Imputation Iteration | None |
| 22 | Numeric Imputer | mean |
| 23 | Iterative Imputation Numeric Model | None |
| 24 | Categorical Imputer | constant |
| 25 | Iterative Imputation Categorical Model | None |
| 26 | Unknown Categoricals Handling | least_frequent |
| 27 | Normalize | False |
| 28 | Normalize Method | None |
| 29 | Transformation | False |
| 30 | Transformation Method | None |
| 31 | PCA | False |
| 32 | PCA Method | None |
| 33 | PCA Components | None |
| 34 | Ignore Low Variance | False |
| 35 | Combine Rare Levels | False |
| 36 | Rare Level Threshold | None |
| 37 | Numeric Binning | False |
| 38 | Remove Outliers | False |
| 39 | Outliers Threshold | None |
| 40 | Remove Multicollinearity | False |
| 41 | Multicollinearity Threshold | None |
| 42 | Remove Perfect Collinearity | True |
| 43 | Clustering | False |
| 44 | Clustering Iteration | None |
| 45 | Polynomial Features | False |
| 46 | Polynomial Degree | None |
| 47 | Trignometry Features | False |
| 48 | Polynomial Threshold | None |
| 49 | Group Features | False |
| 50 | Feature Selection | False |
| 51 | Feature Selection Method | classic |
| 52 | Features Selection Threshold | None |
| 53 | Feature Interaction | False |
| 54 | Feature Ratio | False |
| 55 | Interaction Threshold | None |
| 56 | Transform Target | True |
| 57 | Transform Target Method | box-cox |
Train and Evaluation all Models
best = compare_models(sort='MAE')
| Model | MAE | MSE | RMSE | R2 | RMSLE | MAPE | TT (Sec) | |
|---|---|---|---|---|---|---|---|---|
| lar | Least Angle Regression | 22.3980 | 923.8646 | 28.2855 | 0.5621 | 0.0878 | 0.0746 | 0.0100 |
| lr | Linear Regression | 22.3981 | 923.8726 | 28.2856 | 0.5621 | 0.0878 | 0.0746 | 0.7533 |
| huber | Huber Regressor | 22.4145 | 890.8041 | 27.9201 | 0.5996 | 0.0879 | 0.0749 | 0.0133 |
| br | Bayesian Ridge | 22.4783 | 932.2165 | 28.5483 | 0.5611 | 0.0884 | 0.0746 | 0.0067 |
| ridge | Ridge Regression | 23.1976 | 1003.9426 | 30.0410 | 0.5258 | 0.0933 | 0.0764 | 0.5433 |
| lasso | Lasso Regression | 38.4188 | 2413.5112 | 46.8468 | 0.0882 | 0.1473 | 0.1241 | 0.5833 |
| en | Elastic Net | 40.6486 | 2618.8760 | 49.4048 | -0.0824 | 0.1563 | 0.1349 | 0.6100 |
| omp | Orthogonal Matching Pursuit | 44.3054 | 3048.2658 | 53.8613 | -0.4499 | 0.1713 | 0.1520 | 0.0100 |
| xgboost | Extreme Gradient Boosting | 46.7192 | 3791.0476 | 59.9683 | -0.5515 | 0.1962 | 0.1432 | 0.0900 |
| gbr | Gradient Boosting Regressor | 50.1533 | 3999.2462 | 60.8044 | -0.5727 | 0.2006 | 0.1532 | 0.0133 |
| rf | Random Forest Regressor | 50.5690 | 4353.5509 | 63.1335 | -0.6559 | 0.2049 | 0.1522 | 0.1667 |
| par | Passive Aggressive Regressor | 54.4213 | 5240.3837 | 65.8810 | -0.6782 | 0.2058 | 0.1599 | 0.0100 |
| et | Extra Trees Regressor | 55.3698 | 4586.5516 | 64.8302 | -0.7724 | 0.2189 | 0.1708 | 0.1700 |
| dt | Decision Tree Regressor | 56.7172 | 5950.5556 | 69.7680 | -0.8908 | 0.2224 | 0.1670 | 0.0100 |
| ada | AdaBoost Regressor | 58.5851 | 5701.3655 | 72.0880 | -1.1245 | 0.2377 | 0.1757 | 0.0233 |
| knn | K Neighbors Regressor | 64.1165 | 7098.4735 | 78.7031 | -1.4511 | 0.2582 | 0.1882 | 0.0433 |
| lightgbm | Light Gradient Boosting Machine | 76.8521 | 8430.4943 | 91.0063 | -2.9097 | 0.3379 | 0.2490 | 0.0133 |
| llar | Lasso Least Angle Regression | 129.0182 | 21858.5806 | 138.1309 | -6.5554 | 0.5446 | 0.3958 | 0.0100 |
prediction_holdout = predict_model(best)
| Model | MAE | MSE | RMSE | R2 | RMSLE | MAPE | |
|---|---|---|---|---|---|---|---|
| 0 | Least Angle Regression | 25.0714 | 972.2733 | 31.1813 | 0.8245 | 0.0692 | 0.0571 |
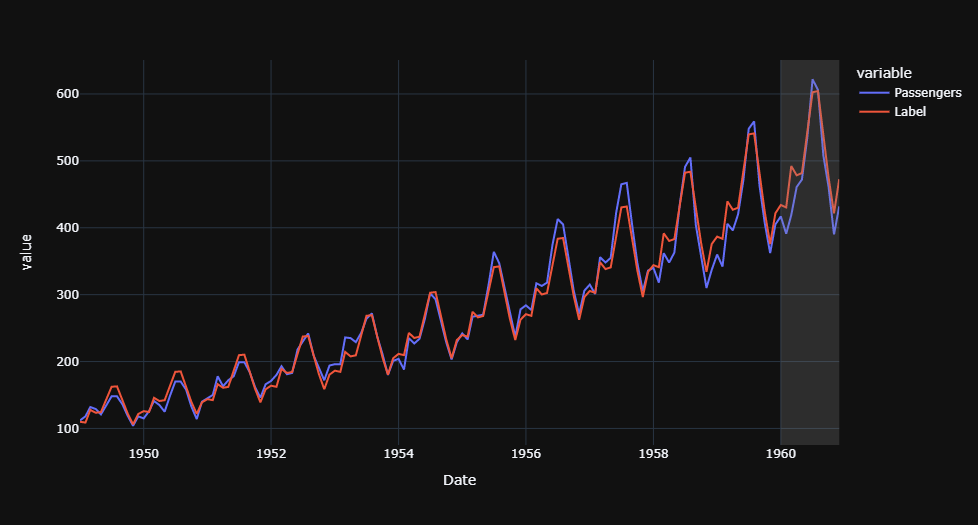
predictions = predict_model(best, data=data)
predictions['Date'] = pd.date_range(start='1949-01-01', end='1960-12-01', freq='MS')
fig = px.line(predictions, x='Date',y=['Passengers','Label'], template='plotly_dark')
fig.add_vrect(x0='1960-01-01', x1='1960-12-01', fillcolor='grey',opacity=.25, line_width=0)
fig.show()

final_best = finalize_model(best)
Forecast
future_dates = pd.date_range(start = '1961-01-01', end = '1965-01-01', freq = 'MS')
future_df = pd.DataFrame()
future_df['Month'] = [i.month for i in future_dates]
future_df['Year'] = [i.year for i in future_dates]
future_df['Series'] = np.arange(145, (145 + len(future_dates)))

future_df.head()
| Month | Year | Series | |
|---|---|---|---|
| 0 | 1 | 1961 | 145 |
| 1 | 2 | 1961 | 146 |
| 2 | 3 | 1961 | 147 |
| 3 | 4 | 1961 | 148 |
| 4 | 5 | 1961 | 149 |
predictions_future = predict_model(final_best, data=future_df)
predictions_future.head()
| Month | Year | Series | Label | |
|---|---|---|---|---|
| 0 | 1 | 1961 | 145 | 486.278267 |
| 1 | 2 | 1961 | 146 | 482.208187 |
| 2 | 3 | 1961 | 147 | 550.485967 |
| 3 | 4 | 1961 | 148 | 535.187177 |
| 4 | 5 | 1961 | 149 | 538.923789 |
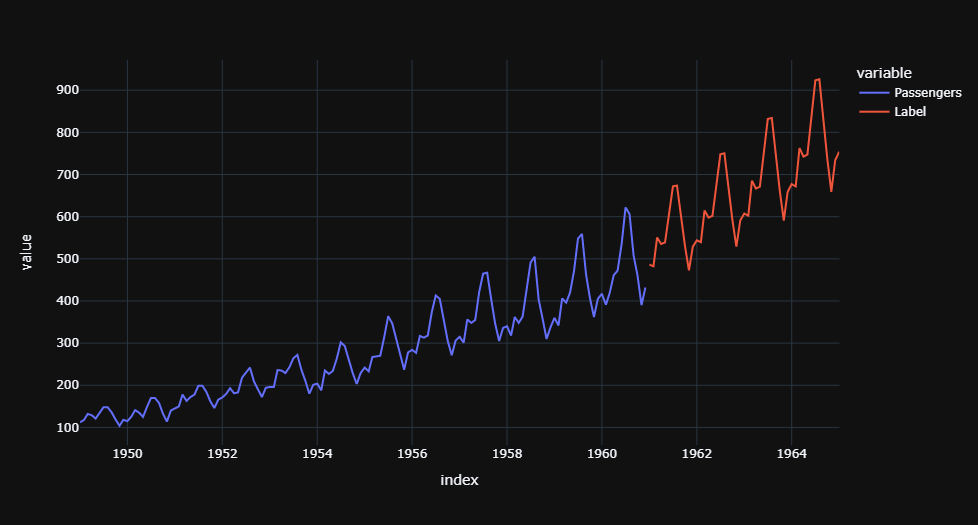
concat_df = pd.concat([data, predictions_future], axis=0)
concat_df_i = pd.date_range(start='1949-01-01', end='1965-01-01', freq='MS')
concat_df.set_index(concat_df_i, inplace=True)
fig = px.line(concat_df, x=concat_df.index, y=['Passengers', 'Label'], template='plotly_dark')
fig.show()

Reference : Time Series Forecasting with PyCaret Regression Module