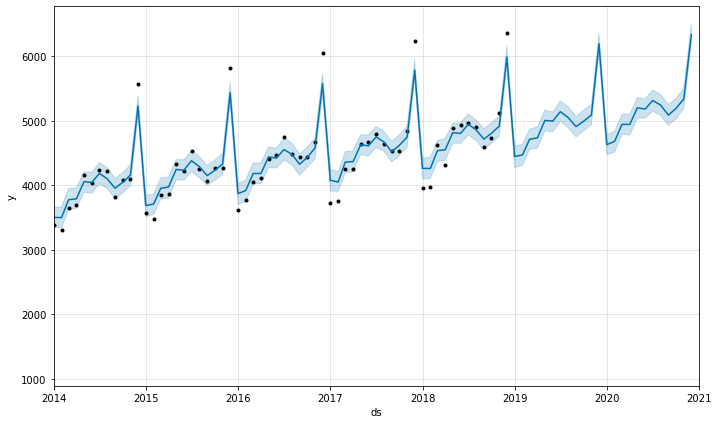
Time Series Analysis - fbprophet
fbprophet
import pandas as pd
from fbprophet import Prophet
df = pd.read_csv('Data/BeerWineLiquor.csv')
df.head()
| date | beer | |
|---|---|---|
| 0 | 1/1/1992 | 1509 |
| 1 | 2/1/1992 | 1541 |
| 2 | 3/1/1992 | 1597 |
| 3 | 4/1/1992 | 1675 |
| 4 | 5/1/1992 | 1822 |
df.info()
<class 'pandas.core.frame.DataFrame'>
RangeIndex: 324 entries, 0 to 323
Data columns (total 2 columns):
 #   Column  Non-Null Count  Dtype
---  ------  --------------  -----
 0   date    324 non-null    object
 1   beer    324 non-null    int64
dtypes: int64(1), object(1)
memory usage: 5.2+ KB
df.columns = ['ds','y']
df.head()
| ds | y | |
|---|---|---|
| 0 | 1/1/1992 | 1509 |
| 1 | 2/1/1992 | 1541 |
| 2 | 3/1/1992 | 1597 |
| 3 | 4/1/1992 | 1675 |
| 4 | 5/1/1992 | 1822 |
df['ds'] = pd.to_datetime(df['ds'])
df.head()
| ds | y | |
|---|---|---|
| 0 | 1992-01-01 | 1509 |
| 1 | 1992-02-01 | 1541 |
| 2 | 1992-03-01 | 1597 |
| 3 | 1992-04-01 | 1675 |
| 4 | 1992-05-01 | 1822 |
df.info()
<class 'pandas.core.frame.DataFrame'>
RangeIndex: 324 entries, 0 to 323
Data columns (total 2 columns):
 #   Column  Non-Null Count  Dtype
---  ------  --------------  -----
 0   ds      324 non-null    datetime64[ns]
 1   y       324 non-null    int64
dtypes: datetime64[ns](1), int64(1)
memory usage: 5.2 KB
m = Prophet()

m.fit(df)
INFO:fbprophet:Disabling weekly seasonality. Run prophet with weekly_seasonality=True to override this.
INFO:fbprophet:Disabling daily seasonality. Run prophet with daily_seasonality=True to override this.


<fbprophet.forecaster.Prophet at 0x195b664a048>
future = m.make_future_dataframe(periods=24, freq='MS')
future
| ds | |
|---|---|
| 0 | 1992-01-01 |
| 1 | 1992-02-01 |
| 2 | 1992-03-01 |
| 3 | 1992-04-01 |
| 4 | 1992-05-01 |
| ... | ... |
| 343 | 2020-08-01 |
| 344 | 2020-09-01 |
| 345 | 2020-10-01 |
| 346 | 2020-11-01 |
| 347 | 2020-12-01 |
348 rows × 1 columns
df.tail()
| ds | y | |
|---|---|---|
| 319 | 2018-08-01 | 4898 |
| 320 | 2018-09-01 | 4598 |
| 321 | 2018-10-01 | 4737 |
| 322 | 2018-11-01 | 5130 |
| 323 | 2018-12-01 | 6370 |
future.tail()
| ds | |
|---|---|
| 343 | 2020-08-01 |
| 344 | 2020-09-01 |
| 345 | 2020-10-01 |
| 346 | 2020-11-01 |
| 347 | 2020-12-01 |
print(len(df))
print(len(future))
324
348
forecast = m.predict(future)
forecast
| ds | trend | yhat_lower | yhat_upper | trend_lower | trend_upper | additive_terms | additive_terms_lower | additive_terms_upper | yearly | yearly_lower | yearly_upper | multiplicative_terms | multiplicative_terms_lower | multiplicative_terms_upper | yhat | |
|---|---|---|---|---|---|---|---|---|---|---|---|---|---|---|---|---|
| 0 | 1992-01-01 | 1778.389678 | 1162.489880 | 1477.941694 | 1778.389678 | 1778.389678 | -461.901459 | -461.901459 | -461.901459 | -461.901459 | -461.901459 | -461.901459 | 0.0 | 0.0 | 0.0 | 1316.488218 |
| 1 | 1992-02-01 | 1780.987184 | 1190.076650 | 1515.528138 | 1780.987184 | 1780.987184 | -427.924955 | -427.924955 | -427.924955 | -427.924955 | -427.924955 | -427.924955 | 0.0 | 0.0 | 0.0 | 1353.062229 |
| 2 | 1992-03-01 | 1783.417109 | 1437.570650 | 1768.918182 | 1783.417109 | 1783.417109 | -179.677739 | -179.677739 | -179.677739 | -179.677739 | -179.677739 | -179.677739 | 0.0 | 0.0 | 0.0 | 1603.739371 |
| 3 | 1992-04-01 | 1786.014616 | 1420.623061 | 1746.514284 | 1786.014616 | 1786.014616 | -196.091481 | -196.091481 | -196.091481 | -196.091481 | -196.091481 | -196.091481 | 0.0 | 0.0 | 0.0 | 1589.923135 |
| 4 | 1992-05-01 | 1788.528331 | 1683.898940 | 2005.729855 | 1788.528331 | 1788.528331 | 45.713009 | 45.713009 | 45.713009 | 45.713009 | 45.713009 | 45.713009 | 0.0 | 0.0 | 0.0 | 1834.241340 |
| ... | ... | ... | ... | ... | ... | ... | ... | ... | ... | ... | ... | ... | ... | ... | ... | ... |
| 343 | 2020-08-01 | 5204.920380 | 5084.057969 | 5410.213286 | 5192.805710 | 5217.161608 | 40.765082 | 40.765082 | 40.765082 | 40.765082 | 40.765082 | 40.765082 | 0.0 | 0.0 | 0.0 | 5245.685462 |
| 344 | 2020-09-01 | 5221.075787 | 4928.327820 | 5254.378883 | 5207.949767 | 5234.472907 | -132.510619 | -132.510619 | -132.510619 | -132.510619 | -132.510619 | -132.510619 | 0.0 | 0.0 | 0.0 | 5088.565168 |
| 345 | 2020-10-01 | 5236.710051 | 5031.756676 | 5349.758431 | 5222.760534 | 5250.974553 | -43.280888 | -43.280888 | -43.280888 | -43.280888 | -43.280888 | -43.280888 | 0.0 | 0.0 | 0.0 | 5193.429163 |
| 346 | 2020-11-01 | 5252.865458 | 5193.204708 | 5505.269976 | 5237.580236 | 5268.257137 | 87.236362 | 87.236362 | 87.236362 | 87.236362 | 87.236362 | 87.236362 | 0.0 | 0.0 | 0.0 | 5340.101820 |
| 347 | 2020-12-01 | 5268.499722 | 6196.217158 | 6508.591160 | 5251.861675 | 5285.213636 | 1071.594904 | 1071.594904 | 1071.594904 | 1071.594904 | 1071.594904 | 1071.594904 | 0.0 | 0.0 | 0.0 | 6340.094626 |
348 rows × 16 columns
forecast.columns
Index(['ds', 'trend', 'yhat_lower', 'yhat_upper', 'trend_lower', 'trend_upper',
       'additive_terms', 'additive_terms_lower', 'additive_terms_upper',
       'yearly', 'yearly_lower', 'yearly_upper', 'multiplicative_terms',
       'multiplicative_terms_lower', 'multiplicative_terms_upper', 'yhat'],
      dtype='object')
forecast[['ds','yhat_lower', 'yhat_upper','yhat']].tail(12)
| ds | yhat_lower | yhat_upper | yhat | |
|---|---|---|---|---|
| 336 | 2020-01-01 | 4476.520302 | 4784.982116 | 4632.015644 |
| 337 | 2020-02-01 | 4514.459845 | 4838.813515 | 4682.147555 |
| 338 | 2020-03-01 | 4789.785892 | 5098.339918 | 4945.507893 |
| 339 | 2020-04-01 | 4780.225878 | 5107.184054 | 4945.249558 |
| 340 | 2020-05-01 | 5042.596291 | 5358.611803 | 5202.688312 |
| 341 | 2020-06-01 | 5041.145483 | 5343.992580 | 5183.565324 |
| 342 | 2020-07-01 | 5149.825503 | 5478.871858 | 5316.228164 |
| 343 | 2020-08-01 | 5084.057969 | 5410.213286 | 5245.685462 |
| 344 | 2020-09-01 | 4928.327820 | 5254.378883 | 5088.565168 |
| 345 | 2020-10-01 | 5031.756676 | 5349.758431 | 5193.429163 |
| 346 | 2020-11-01 | 5193.204708 | 5505.269976 | 5340.101820 |
| 347 | 2020-12-01 | 6196.217158 | 6508.591160 | 6340.094626 |
import matplotlib.pyplot as plt
%matplotlib inline

m.plot(forecast)
plt.xlim('2014-01-01', '2021-01-01')
(array(16071.), array(18628.))
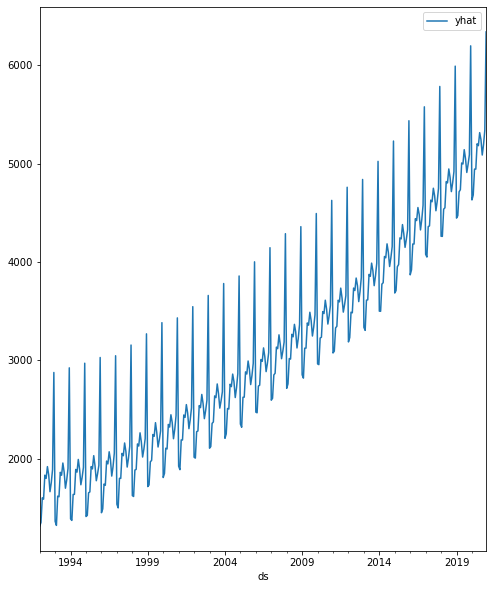
forecast.plot(x='ds',y='yhat', figsize=(8, 10))
<AxesSubplot:xlabel='ds'>
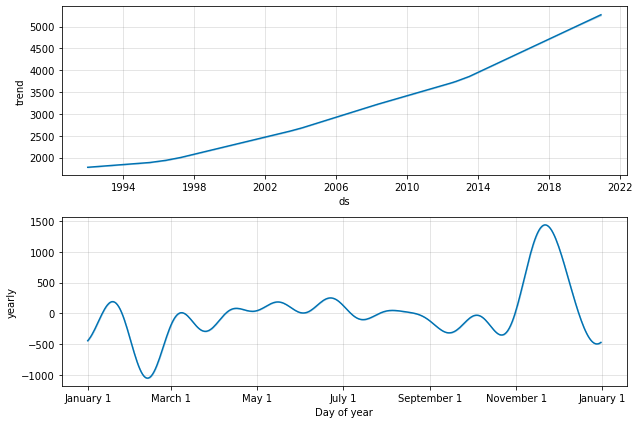
m.plot_components(forecast);
Prophet Evaluation
df = pd.read_csv('Data/Miles_Traveled.csv')
df.info()
<class 'pandas.core.frame.DataFrame'>
RangeIndex: 588 entries, 0 to 587
Data columns (total 2 columns):
 #   Column            Non-Null Count  Dtype
---  ------            --------------  -----
 0   DATE              588 non-null    object
 1   TRFVOLUSM227NFWA  588 non-null    float64
dtypes: float64(1), object(1)
memory usage: 9.3+ KB
df.columns = ['ds', 'y']
df['ds'] = pd.to_datetime(df['ds'])
df.head()
| ds | y | |
|---|---|---|
| 0 | 1970-01-01 | 80173.0 |
| 1 | 1970-02-01 | 77442.0 |
| 2 | 1970-03-01 | 90223.0 |
| 3 | 1970-04-01 | 89956.0 |
| 4 | 1970-05-01 | 97972.0 |
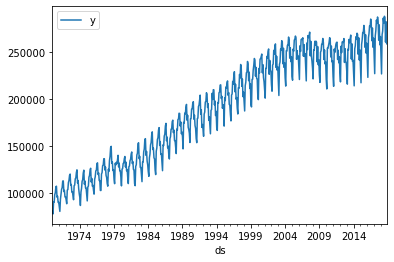
df.plot(x='ds',y='y')
<AxesSubplot:xlabel='ds'>
len(df)
588
train = df.iloc[:576]
test = df.iloc[576:]
m = Prophet()
m.fit(train)
future = m.make_future_dataframe(periods=12,freq='MS')
forecast = m.predict(future)
INFO:fbprophet:Disabling weekly seasonality. Run prophet with weekly_seasonality=True to override this.
INFO:fbprophet:Disabling daily seasonality. Run prophet with daily_seasonality=True to override this.
forecast.tail()
| ds | trend | yhat_lower | yhat_upper | trend_lower | trend_upper | additive_terms | additive_terms_lower | additive_terms_upper | yearly | yearly_lower | yearly_upper | multiplicative_terms | multiplicative_terms_lower | multiplicative_terms_upper | yhat | |
|---|---|---|---|---|---|---|---|---|---|---|---|---|---|---|---|---|
| 583 | 2018-08-01 | 263219.378669 | 274005.563021 | 285854.055723 | 263165.973306 | 263286.645515 | 16451.125033 | 16451.125033 | 16451.125033 | 16451.125033 | 16451.125033 | 16451.125033 | 0.0 | 0.0 | 0.0 | 279670.503702 |
| 584 | 2018-09-01 | 263357.665883 | 255845.729306 | 267358.811392 | 263268.467813 | 263466.096392 | -1666.545411 | -1666.545411 | -1666.545411 | -1666.545411 | -1666.545411 | -1666.545411 | 0.0 | 0.0 | 0.0 | 261691.120472 |
| 585 | 2018-10-01 | 263491.492218 | 262880.627108 | 274558.498098 | 263368.767781 | 263640.637785 | 5310.587893 | 5310.587893 | 5310.587893 | 5310.587893 | 5310.587893 | 5310.587893 | 0.0 | 0.0 | 0.0 | 268802.080112 |
| 586 | 2018-11-01 | 263629.779432 | 249738.034670 | 261701.249744 | 263456.755896 | 263809.346746 | -8203.436940 | -8203.436940 | -8203.436940 | -8203.436940 | -8203.436940 | -8203.436940 | 0.0 | 0.0 | 0.0 | 255426.342492 |
| 587 | 2018-12-01 | 263763.605767 | 251277.958828 | 262955.321543 | 263569.324677 | 264002.170664 | -6916.514689 | -6916.514689 | -6916.514689 | -6916.514689 | -6916.514689 | -6916.514689 | 0.0 | 0.0 | 0.0 | 256847.091078 |
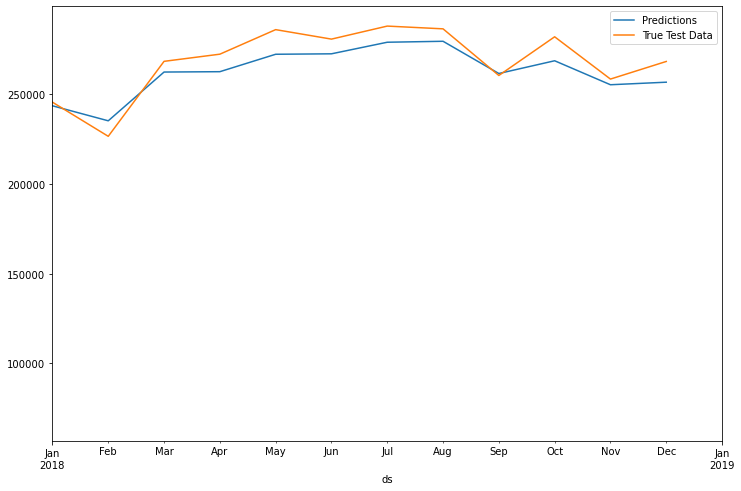
ax = forecast.plot(x='ds',y='yhat', label='Predictions',legend=True, figsize=(12,8))
test.plot(x='ds',y='y',label='True Test Data', legend=True, ax=ax,
         xlim=('2018-01-01','2019-01-01'))
<AxesSubplot:xlabel='ds'>
from statsmodels.tools.eval_measures import rmse
predictions = forecast.iloc[-12:]['yhat']
predictions
576    243683.663737
577    235311.776917
578    262511.200772
579    262708.863987
580    272429.495856
581    272679.913346
582    279136.474721
583    279670.503702
584    261691.120472
585    268802.080112
586    255426.342492
587    256847.091078
Name: yhat, dtype: float64
test['y']
576    245695.0
577    226660.0
578    268480.0
579    272475.0
580    286164.0
581    280877.0
582    288145.0
583    286608.0
584    260595.0
585    282174.0
586    258590.0
587    268413.0
Name: y, dtype: float64
rmse(predictions, test['y'])
8750.25052083061
test.mean()
C:\Users\ilvna\.conda\envs\tf-2.3\lib\site-packages\ipykernel_launcher.py:1: FutureWarning:

DataFrame.mean and DataFrame.median with numeric_only=None will include datetime64 and datetime64tz columns in a future version.


y    268739.666667
dtype: float64
from fbprophet.diagnostics import cross_validation, performance_metrics
from fbprophet.plot import plot_cross_validation_metric
# INITIAL
initial = 5 * 365
initial = str(initial) + ' days'
# PERIOD
period = 5 * 365
period = str(period) + ' days'
# HORIZION
horizon = 365
horizon = str(horizon) + ' days'
df_cv = cross_validation(m,initial=initial, period=period, horizon = horizon)
INFO:fbprophet:Making 9 forecasts with cutoffs between 1976-12-11 00:00:00 and 2016-12-01 00:00:00
df_cv.head()
| ds | yhat | yhat_lower | yhat_upper | y | cutoff | |
|---|---|---|---|---|---|---|
| 0 | 1977-01-01 | 108479.087389 | 106886.766224 | 109878.212671 | 102445.0 | 1976-12-11 |
| 1 | 1977-02-01 | 102996.111525 | 101535.125858 | 104359.275043 | 102416.0 | 1976-12-11 |
| 2 | 1977-03-01 | 118973.318113 | 117492.329065 | 120504.309675 | 119960.0 | 1976-12-11 |
| 3 | 1977-04-01 | 120612.923709 | 119128.403891 | 122021.648614 | 121513.0 | 1976-12-11 |
| 4 | 1977-05-01 | 127883.031830 | 126331.087726 | 129351.363487 | 128884.0 | 1976-12-11 |
len(df_cv)
108
performance_metrics(df_cv)
| horizon | mse | rmse | mae | mape | mdape | coverage | |
|---|---|---|---|---|---|---|---|
| 0 | 52 days | 2.437359e+07 | 4936.961190 | 4528.637861 | 0.027750 | 0.023384 | 0.4 |
| 1 | 53 days | 2.187095e+07 | 4676.638408 | 4262.628303 | 0.024999 | 0.023384 | 0.4 |
| 2 | 54 days | 1.842045e+07 | 4291.904691 | 3732.310696 | 0.020061 | 0.022021 | 0.5 |
| 3 | 55 days | 2.351247e+07 | 4848.965429 | 4271.125183 | 0.023241 | 0.023384 | 0.4 |
| 4 | 57 days | 2.115130e+07 | 4599.053997 | 3989.900860 | 0.021416 | 0.022021 | 0.5 |
| ... | ... | ... | ... | ... | ... | ... | ... |
| 94 | 360 days | 1.862165e+07 | 4315.281433 | 3775.153749 | 0.019707 | 0.019425 | 0.5 |
| 95 | 361 days | 1.777184e+07 | 4215.666214 | 3507.111932 | 0.018367 | 0.018879 | 0.5 |
| 96 | 362 days | 3.210247e+07 | 5665.904399 | 4435.117794 | 0.022175 | 0.024755 | 0.4 |
| 97 | 364 days | 3.022906e+07 | 5498.095592 | 4257.907114 | 0.021507 | 0.021415 | 0.5 |
| 98 | 365 days | 5.578676e+07 | 7469.053614 | 5689.503458 | 0.026806 | 0.025276 | 0.4 |
99 rows × 7 columns
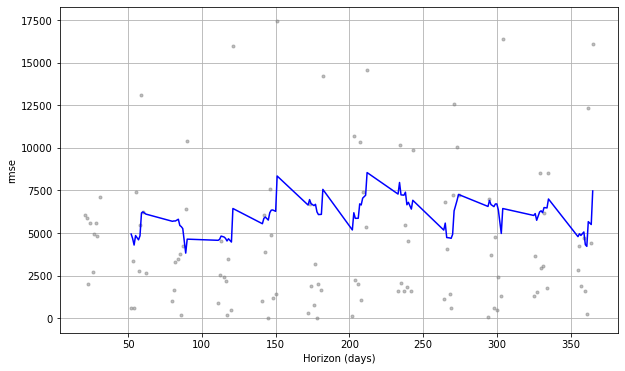
plot_cross_validation_metric(df_cv, metric='rmse');
Facebook prophet Trend
import pandas as pd
from fbprophet import Prophet
%matplotlib inline
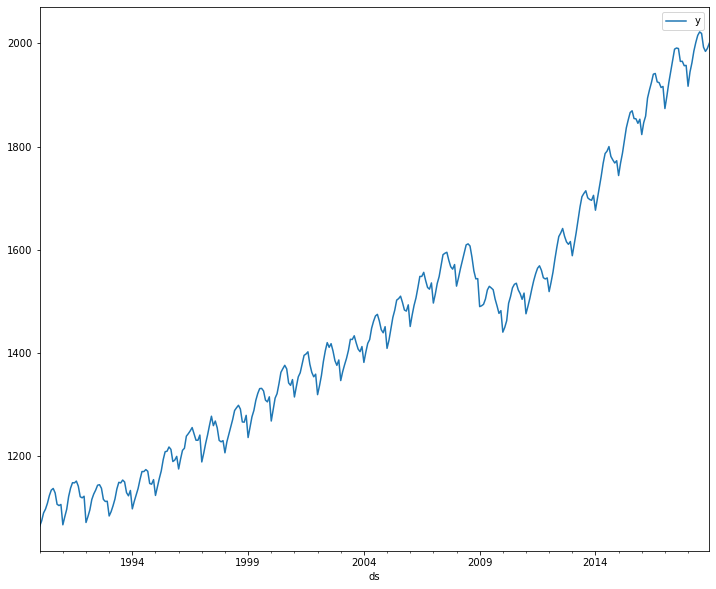
df = pd.read_csv('Data/HospitalityEmployees.csv')
df.columns = ['ds', 'y']
df['ds'] = pd.to_datetime(df['ds'])
df.plot(x='ds', y='y', figsize=(12,10))
<AxesSubplot:xlabel='ds'>
m = Prophet()
m.fit(df)
future = m.make_future_dataframe(periods=12,freq='MS')
forecast = m.predict(future)
C:\Users\ilvna\.conda\envs\tf-2.3\lib\importlib\_bootstrap.py:219: RuntimeWarning:

numpy.ufunc size changed, may indicate binary incompatibility. Expected 192 from C header, got 216 from PyObject

C:\Users\ilvna\.conda\envs\tf-2.3\lib\importlib\_bootstrap.py:219: RuntimeWarning:

numpy.ufunc size changed, may indicate binary incompatibility. Expected 192 from C header, got 216 from PyObject

C:\Users\ilvna\.conda\envs\tf-2.3\lib\importlib\_bootstrap.py:219: RuntimeWarning:

numpy.ufunc size changed, may indicate binary incompatibility. Expected 192 from C header, got 216 from PyObject

INFO:fbprophet:Disabling weekly seasonality. Run prophet with weekly_seasonality=True to override this.
INFO:fbprophet:Disabling daily seasonality. Run prophet with daily_seasonality=True to override this.
from fbprophet.plot import add_changepoints_to_plot
fig = m.plot(forecast)
a = add_changepoints_to_plot(fig.gca(),m, forecast)
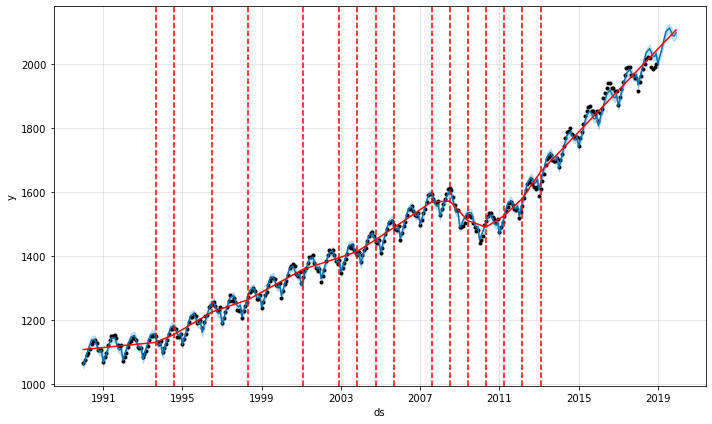
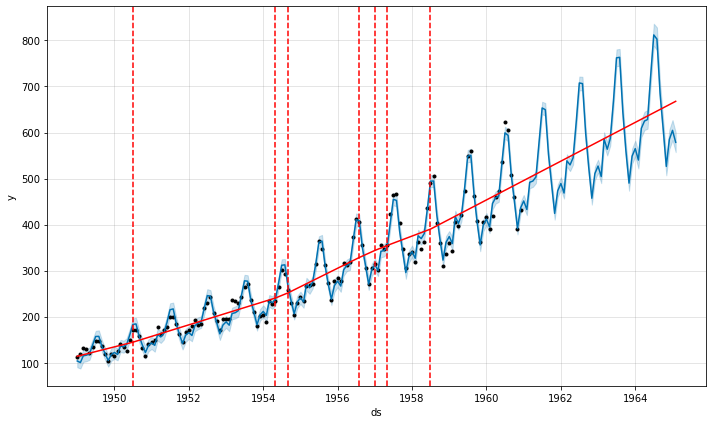
Facebook Prophet Seasonality
df = pd.read_csv('Data/airline_passengers.csv')
df.head()
| Month | Thousands of Passengers | |
|---|---|---|
| 0 | 1949-01 | 112 |
| 1 | 1949-02 | 118 |
| 2 | 1949-03 | 132 |
| 3 | 1949-04 | 129 |
| 4 | 1949-05 | 121 |
df.columns = ['ds', 'y']
df['ds'] = pd.to_datetime(df['ds'])
m = Prophet()
m.fit(df)
future = m.make_future_dataframe(50, freq='MS')
forecast = m.predict(future)
fig = m.plot(forecast)
INFO:fbprophet:Disabling weekly seasonality. Run prophet with weekly_seasonality=True to override this.
INFO:fbprophet:Disabling daily seasonality. Run prophet with daily_seasonality=True to override this.
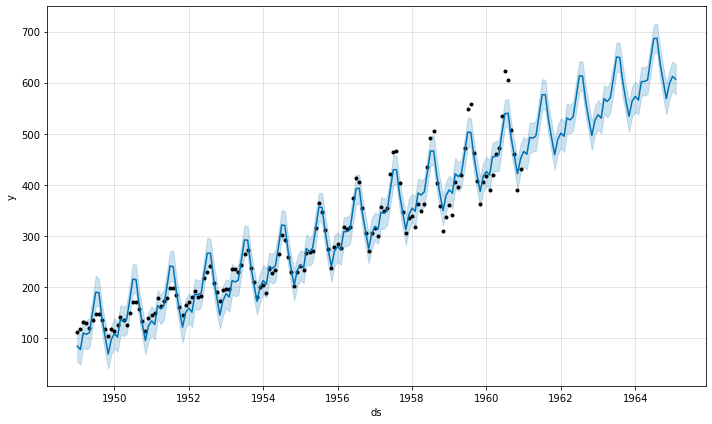
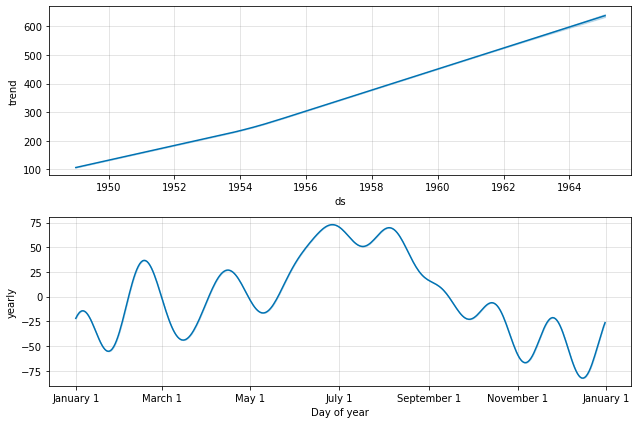
fig = m.plot_components(forecast);
from fbprophet.plot import add_changepoints_to_plot
fig = m.plot(forecast)
a = add_changepoints_to_plot(fig.gca(),m, forecast)
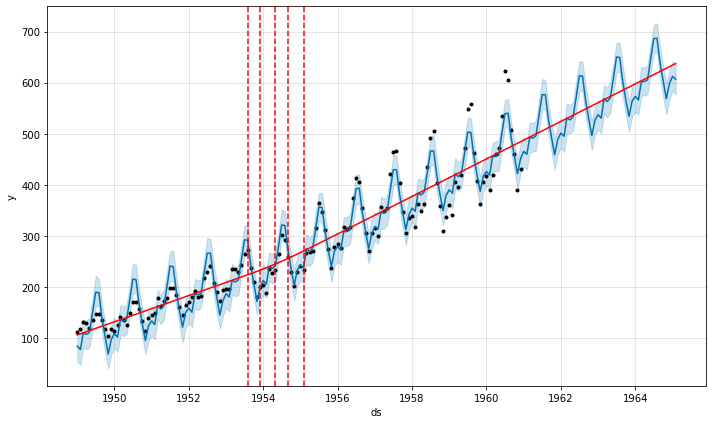
m = Prophet(seasonality_mode='multiplicative')
m.fit(df)
future = m.make_future_dataframe(50, freq='MS')
forecast = m.predict(future)
fig = m.plot(forecast)
b = add_changepoints_to_plot(fig.gca(), m, forecast)
INFO:fbprophet:Disabling weekly seasonality. Run prophet with weekly_seasonality=True to override this.
INFO:fbprophet:Disabling daily seasonality. Run prophet with daily_seasonality=True to override this.